CSCI 270 - Lab 3
Data Visualizing
Description
Our first attempt to summarize our documents is to calculate and visualize statistical
information. Use a Jupyter Notebook to track your analysis of your data. Write the answers
for each section inline with Markdown blocks, and section your document with Header blocks.
Be sure to cite any outside sources you use for Python reminders and snippets of code.
Repeat the following steps for both your poem and book documents.
General Statistics
Open the file and load the text into memory. Calculate the following statistics:
- How many total characters?
- How many letters?
- How many sentences?
- How many tokens?
- How many word types? (unique tokens)
Your tokens should not include any punctuation, only alphanumeric characters.
Frequency Counts
Find the frequency counts for the letters in your document.
Create a barplot to display this data, with the tick marks labeled with the appropriate letter.
Find the frequency counts for the lengths of tokens in your document.
Create a barplot to display this data.
Find the frequency counts for the lengths of sentences in your document.
Create a barplot to display this data.
Compare and contrast these two graphs.
Reading Level
Write a function to calculate the Flesch-Kincaid Grade Level Formula:
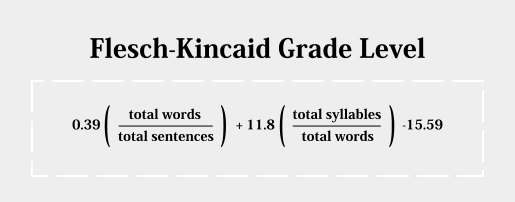
Assess the reading level of your document using your function.
Use the number of vowels in your document as a substitute for the total number of syllables.
Does this match your assumptions?
Zipf's Law
Find the frequency counts for the tokens in your document. Rank the tokens
in descending order based on their counts.
Create a log-log plot where
the x-axis is the rank of the token, and the y axis is the frequency count for that token.
Add to your plot a line graph of Zipf's law, where the y value is the frequency count of the
top ranked token divided by the x value.
Discuss how closely your document follows Zipf's law.
Calculate the frequency of each of these frequency counts. What percent of your tokens are only found in the document once?
These are known as hapax legomena which means "read only once." When translating texts, these
tokens are difficult to process because they lack repeated statistical context clues for their meaning.
Word Clouds
Use the code discussed in class to create a Word Cloud for your document.
The text of some elements in a Word Cloud is often rotated 90 degrees.
Investigate
Text Rotation in matplotlib and incorporate it into your Word Cloud, so that
each word has a 50% chance of being displayed vertically.
Sentence Drawing
A Sentence Drawing
can be constructed from a document to visualize the flow and rhythm of the text. Implement
the following algorithm and create a diagram for your document.
- Start at point 0,0, pointing north
- For each sentence in your document
- Draw a line forward where the length is the number of words in the sentence
- Turn right 90 degrees
If your document is very large, only draw this image for the first section/chapter.
What insights on your document can you gather from this image?
What to Hand In
Turn in your .ipynb file to the Lab 3 directory on Moodle.
© Mark Goadrich, Hendrix College